Dumb classifiers
When assessing how good your classification model is, you are likely to use one of the following performance metrics:
precision: the proportion of true positive cases (true positive cases and predicted positive cases) among the predicted positive cases.
Recall: the proportion of truly positive cases (truly positive cases and presumably positive cases) among all truly positive cases
F1-score: harmonic mean of accuracy and retention
accuracy: proportion of correctly predicted cases among all cases
Note that precision, responsiveness, and F1 score work with the reference category. This is usually the target category that interests, for example:
The person is pregnant (as opposed to a non-pregnant person).
The person does convert (as opposed to not becoming a customer).
The email is spam (as opposed to legitimate).
When using these performance indicators, it is worth comparing them with the baseline. What would be a good base? I think that dumb, non-AI classifiers are a good start. They ignore all information about objects and instead rely solely on information about the purpose of the classification.
In this blog post, I’ll focus on three dumb binary classifiers:
Coin Flip: This model flips a coin every time it sees a box. It is assumed that half of the cases are in the reference category and half are not.
Always predict the link category: This model always predicts that cases will be in the link category no matter what. It is like tossing a coin where each time is face up.
Correct proportion prediction: This model is aware of the proportion of the reference category in the dataset and changes its predictions accordingly. The proportion of link category cases in the actual target vector is the same as the predicted target vector. The rest of the classification is random.
The coin flip performance
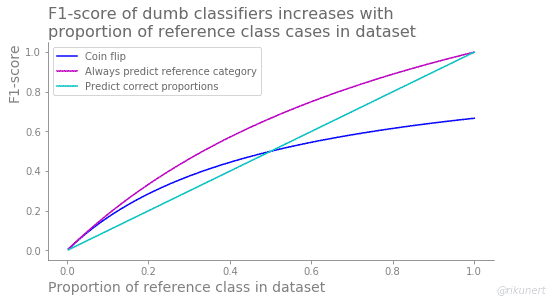
The coin flip classifier predicts half the cases as belonging to the reference category. Therefore its recall and its accuracy are always 50%. The precision score behaves completely differently for this dumb classifier. It always has the same values as the reference category proportion. As a result the F1-score correlates with the proportion of reference category cases as well, albeit less strongly.
The performance of always predicting the reference category
This classifier exclusively predicts positive cases, like a pregnancy test always indicating a pregnancy. As a result, no positive case gets missed and the recall is always 100%. However, accuracy and precision hold the same value as the proportion of reference category cases in the dataset. The F1-score, being a combination of precision and recall, also correlates with the reference category proportion, albeit less strongly.
The performance of randomly predicting the right proportion of positive cases
This classifier predicts the right proportion of reference category cases but it does so randomly. As if the pregnancy test knew how many women were pregnant but not which ones. This classification strategy leads to an accuracy which is always above 50%. Precision, recall and F1-score, on the other hand, hold the same values as the proportion of reference category cases in the dataset.
The best performance among the dumb classifiers
We can summarise these performancy measures individually to get a better overview. What is a good precision baseline? The answer is simple: the proportion of positive cases in the dataset.
What is a good recall baseline? This entirely depends on the classifier strategy.
What is a good F1-score baseline? This also depends on the classifier strategy but in general the F1-score increases with the proportion of positive cases in the dataset.
What is a good accuracy score baseline? This also depends on the classifier strategy. Surprisingly though, many dumb classifiers do not fall below 50%.
The best performance for each proportion of the reference class is summarised in this figure:
Note how recall and accuracy are difficult to interpret as the baseline formed by dumb classifiers is already very high.
Conclusion
The take-home message of this look at dumb classifiers is that no one performance measure is enough to properly evaluate the performance of a model. Random predictions can lead to surprisingly high performance measures, especially for recall and accuracy. Better to look at a number of them to get a full picture. This way you can trust your binary classifier and its predictions.
The complete code to recreate the analyses and plots of this blog post can be found on github here.
Like this post? Share it with your followers or follow me on Twitter!